Page 7 - 810 Trianing Book Extract
P. 7
is transformed into a frequency domain signal
Vibration spectrum analysis vs.
using an algorithm known as the Fast Fourier
overall vibration analysis
Transform (FFT). A detailed description of the FFT
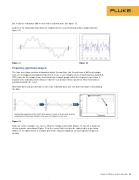
All vibration data is collected in the time domain. is beyond the scope of this white paper, but in
When using a spectrum analyzer or overall vibra- short it reconstructs the time domai
n signal using
T
tion meter, this time domain data is typically a series of harmonic sine waves.
he amplitude
collected from a piezoelectric accelerometer.
of each of these sine waves is then
plotted against
the frequency of the sine waves. T
The accelerometer is placed in rigid contact with he result is
ot. A sample
known as a frequency spectrum pl
a vibrating machine. The machine vibration is
frequency spectrum plot is shown on next page transferred to the accelerometer, which in turn
(Fig B). A properly trained vibration analyst can strains the piezoelectric element within and cre-
use the frequency spectrum to determine which,
ates a voltage signal proportional to the vibration.
if any, machinery laws exist. The analysis can be But really the vibrations addTthoisevaoclhtagoethsiegrnalnids claopotkurmedobryetlhiekespiegctururem13.
somewhat complicated, but a signiicant beneit
analyzer or overall vibration meter. A sample time
And 20 or 30 vibrations from different components of a real rotating machine might llook like
domain signal is shown on next page (Fig A). is that the root cause of the vibration problem can
Once the time domain signal has been captured, typically be identiied.
igure 14.
Figure 13 2 Fluke Corporation Calibration and documentation for process manufactuFrinig: Cuosrtes, b1en4eits and feasibility
Frequency (spectrum) analysis
The time waveform contains information about the machine, but the patterns of different compo-
nent are overlapped and jumbled together to create a very complex view. A mathematical algorithm
(FFT) converts the complex time waveform into a simple graph called the frequency spectrum. It
separates the individual waveforms so that we can analyze them separately. This conversion is
performed inside the tester.
Waveform data and spectral data is the same vibration data, just two different ways of visualizing
the data.
3
44
3 3
2
21 21
0 0 FFT
-1 -1 1
-2 -2 -3 -3
-4 -4
Notice the amplitude of the shaft sine wave (1 cycle) is three units and the
amplitude of the pump impeller sine wave (10 cycles) is one unit.
Figure 15
From our earlier example, we can see how the complex waveform (Figure 15 on left) is made up
of two separate waveforms (Figure 15 in the center) that can then be converted to a spectrum
(Figure 15 on right) which is a simple plot of the signal’s amplitude (y–axis) against frequency
(x-axis).
Chapter 2: Vibration analysis principles 29