Page 16 - 810 Trianing Book Extract
P. 16
C
2
Invalid data
Remember that Garbage in = Garbage out. Your irst indication may be the Serious or Extreme bearing wear, but
the cited peaks or the data may show a different story.
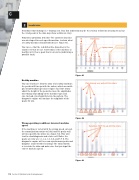
What does good data look like? The synthetic baseline 1X Harmonics
was developed for each speciic machine to show what
a healthy machine should look like (see Figure 81).
You can see that the red dotted line (baseline) is the 4 pump vanes
Anomaly
alarm level that we use to determine if the machine is
healthy or if it has a peak that is excessive (indicating a
possible fault).
Figure 81
Healthy machine
You can clearly see from the data of a healthy machine; Data lines up very well with the orders
the peaks will line up with the orders, which are multi-
ples of motor shaft speed (see igure 82). Don’t worry
about the height of the peaks because the amplitudes
will change depending on the machine type and
size. Instead, you should focus on the pattern. The
diagnostic engine will analyze the amplitude of the
peaks for you.
Figure 82
Wrong operating conditions: incorrect machine
speed
Data does NOT line up with the orders.
If the machine is tested with the wrong speed entered,
the normalization routine will fail and the peaks will
not line up with the orders (see igure 83). This will
lead to a bad diagnosis and a false call. Notice the
peaks are now are 1.1, 2.2, 3.3, 4.4, and 5.5 X. The
diagnostic engine will see non-synchronous peaks and
diagnose a fault of roller bearings. The only solution
is to retake the data and make sure that you input the
correct machine speed.
Figure 83
114 Section 2: Vibration tester training manual